Data Engineering
  Data Strategy + Governance
  Data Migrations
  Concierge + Support
  Artificial Intelligence
  Training + Enablement
  Data Analytics + Insights
  Financial Services
  Communications, Media + Entertainment
  Healthcare + Life Sciences
  Technology + Digital Natives
  Manufacturing + Automotive
  Public Sector
  Retail + Consumer Goods
  Race to the Lakehouse
  AI + Data Maturity Assessment
  Unity Catalog
  Rapid GenAI
  Modern Data Connectivity
  Gatehouse Security
  Health Check
  Sample Use Case Library
  Blog
Blog  Events
  About Us
  Careers
  Founding Team

The Hidden Cost of “It Works on My Notebook”
In my work as Head of AI Practice at Entrada, I see a pattern repeat across industries. A team builds a machine learning model that performs beautifully in a notebook. Training runs finish on time. Predictions look accurate. Stakeholders are happy. Then the pipeline goes to production, and something subtle but expensive begins to happen.
Compute costs creep up. Jobs that used to run in twenty minutes now take ninety. A retraining job that used to fit comfortably in a nightly window starts spilling into business hours. Nobody can quite point to what changed, but everyone agrees something did.
This is the part of machine learning engineering that does not make it into conference talks. It is also where most of the real value of a Databricks investment is either captured or quietly lost.
In this article, I want to walk through the most common Databricks ML pipeline performance pitfalls I encounter when reviewing client environments, and the principles we apply at Entrada to fix them. These are not edge cases. They are the patterns that show up again and again, regardless of industry or model type.
Pitfall 1: Treating Feature Engineering as a Notebook Problem
The single most common performance issue I see in Databricks ML pipelines is feature engineering written as if it will only ever run once, on a small sample, in a single notebook.
The code works. It produces the right features. But it does so by collecting data to the driver, looping in Python, calling user-defined functions when a native Spark function would do the same job, or joining wide tables without thinking about partitioning. When the same code meets production volumes, the cluster groans.
The fix is not glamorous. It is discipline.
Before any feature pipeline goes near production, we ask a short list of questions:
- Is every transformation expressible in native Spark SQL or DataFrame operations?
- Are joins happening on properly clustered keys?
- Are we reading only the columns and partitions we actually need?
- Is the output written in a format and layout that downstream consumers can use efficiently?
This is where data modeling discipline matters more than people expect. The Lakehouse forgives a lot, but it does not forgive bad joins on poorly modeled tables. My colleague William Guzman wrote a strong piece on this in The Lost Art of Data Modeling in the Databricks Lakehouse, and I recommend it as required reading for any team building feature pipelines at scale.
Pitfall 2: Default Cluster Configurations for Non-Default Workloads
Databricks makes it easy to spin up a cluster. That is a feature, not a bug. But it also means that many teams never revisit the configuration after the first week of development.
I have lost count of how many ML pipelines I have reviewed where:
- Photon is disabled on a workload that would benefit from it
- Autoscaling is configured with limits that force the cluster to thrash
- The instance type is wrong for the workload (memory-bound jobs running on compute-optimized nodes, or the reverse)
- A streaming job is running on an all-purpose cluster instead of a jobs cluster
None of these are exotic problems. They are the result of nobody being responsible for cluster economics after the initial setup.
At Entrada, when we run a performance review, cluster configuration is one of the first things we look at. We covered this in detail in our post on optimizing data pipeline performance with Databricks, where the team walks through how Liquid Clustering, Photon, partitioning strategy, and Z-ordering combine to deliver real cost reductions. The same principles apply directly to ML pipelines, often with even bigger payoffs because ML workloads tend to be more compute-intensive.
Pitfall 3: The JVM-to-Python Serialization Tax (The toPandas() Trap)
This is a silent performance killer that slips into pipelines right at the boundary where data engineering ends and machine learning begins.
A data scientist builds an incredibly efficient, scalable feature engineering pipeline using native PySpark. It handles billions of rows without breaking a sweat. But then, right before handing the data over to a standard machine learning framework like Scikit-Learn, LightGBM, or XGBoost, they add a single line of code: df.toPandas().
In a small development environment, this works perfectly. In production, it causes the pipeline to grind to a halt or crash entirely with Out-Of-Memory (OOM) exceptions.
The issue is architectural. PySpark operates within the Java Virtual Machine (JVM). Frameworks like Scikit-Learn operate in native Python. When you call .toPandas(), Spark has to collect all that distributed data, pull it out of the JVM, serialize it, and force it into a single Python process on the driver node. Your massive, expensive cluster instantly transforms into a single, overloaded machine doing heavy lifting over a massive bottleneck.
To avoid paying the serialization tax, we enforce strict boundary discipline in our pipelines:
- If you absolutely must move data between Spark and Pandas, ensure Arrow execution is enabled
(spark.sql.execution.arrow.pyspark.enabled = true).This uses vectorized optimization to radically speed up the data transfer. - For data exploration and early-stage modeling, leverage the PySpark Pandas API to keep operations distributed across the cluster instead of pulling data to the driver.
- Shift to training frameworks that natively accept Spark DataFrames or distributed file paths (such as
xgboost.sparkor Horovod) so the data never has to squeeze through a single process bottleneck.
Pitfall 4: Ignoring the Cost of Small Files
Delta Lake is forgiving. It will let you write thousands of tiny files without complaining. Your queries will still return correct results. But the cost shows up later, in three places:
- Read amplification. Every small file means another metadata lookup, another open file handle, another network round trip.
- Optimize jobs that never run. Many teams set up
OPTIMIZEandVACUUMas an afterthought, or skip them entirely. - Liquid Clustering benefits left on the table. Without proper file management, the clustering keys you carefully chose do not deliver the data skipping they promised.
The fix is to treat table maintenance as part of the pipeline, not as a separate hygiene task. For managed tables in Unity Catalog, predictive optimization handles much of this automatically, which is one of the strongest arguments for moving fully into the managed table model.
Pitfall 5: Training Loops That Reload Data on Every Iteration
This one is specific to ML, and it costs more than most teams realize.
When a training job reads from a Delta table inside a loop, without caching, without checkpointing, and without thinking about how Spark plans the read, you can easily end up reading the same data dozens of times across a single training run. On a small dataset, you will not notice. On a production-scale feature table, the cost is enormous.
The practical fixes are well known but inconsistently applied:
- Materialize the training dataset once, deliberately, with the right partitioning for your training framework as a delta table partition or an MLflow artifact
- Use Databricks Feature Store or Unity Catalog feature tables to centralize and version features
- Cache intermediate results when you genuinely reuse them, and uncache when you do not
- Be honest about whether you need distributed training or whether a single large node would be faster and cheaper
Distributed training is powerful, but it is not free. For many models, a well-configured single-node job with the right data layout will outperform a poorly tuned distributed job.
Pitfall 6: Paying Premium GPU Rates for Low-Cost CPU Work
When teams move into deep learning or large language model (LLM) fine-tuning, the Databricks bill can skyrocket. The assumption is usually that heavy deep learning models just require massive investments in specialized hardware. But when we audit these pipelines, we frequently find that the premium hardware isn’t actually doing the work.
I regularly see pipelines running on expensive GPU instances (like AWS g5 or Azure NC series) where the actual GPU utilization hovers between 0% and 5% for the majority of the job run.
The code isn’t broken; it’s just bottlenecked. The expensive GPU is sitting completely idle, waiting for a single-threaded CPU worker to finish loading images from storage, tokenizing text files, or running string manipulation. You are essentially paying sports car rental rates to sit in bumper-to-bumper traffic.
Maximizing hardware ROI means ensuring that your GPUs are constantly “fed” with data. We structure deep learning pipelines to separate the data bottleneck from the compute engine:
- Decouple Preprocessing from Training: Never run heavy string cleaning, tokenization, or image resizing inside the GPU training loop. Run those operations upstream on a highly parallel, much cheaper CPU-based Spark cluster, and write the final, pristine training arrays directly to Delta Lake.
- Use High-Throughput Data Loaders: When the GPU cluster spins up, it should do nothing but compute. Use optimized, multi-threaded data loaders (such as MosaicML’s
StreamingDatasetor PyTorch’sDataLoaderwith properly tunednum_workers) to stream data from Delta Lake into memory fast enough to keep GPU utilization locked as close to 100% as possible.
Pitfall 7: Treating Inference as an Afterthought
Most performance conversations focus on training. That makes sense, because training is where the big GPU bills live. But in steady-state production, inference is usually where the cumulative cost lives.
A few patterns I keep seeing:
- Batch scoring jobs that re-score the entire universe of records every night, when only a small fraction have changed
- Real-time endpoints provisioned for peak load, running at five percent utilization most of the day
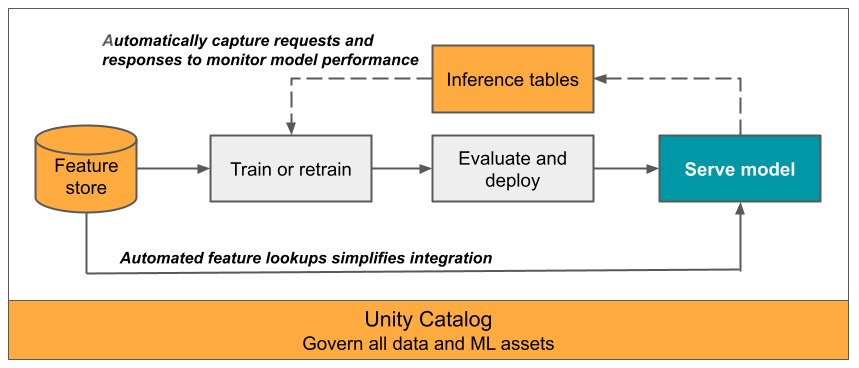
- Models deployed without inference tables enabled, which means no observability and no feedback loop
- Pre- and post-processing logic running in Python where vectorized operations would be an order of magnitude faster
Source: Databricks documentation.
This is exactly the territory we cover in Monitoring ML Models in Production with Databricks. The same observability that protects model quality also surfaces the inference patterns that are quietly burning compute. If you cannot see what your endpoint is doing, you cannot optimize it.
Pitfall 8: Skipping Governance Until It Hurts
This one looks like a governance problem on the surface, but it shows up as a performance problem.
When data assets are not properly cataloged, when lineage is missing, when access patterns are not understood, teams make defensive choices. They copy tables instead of referencing them. They build redundant pipelines because they cannot tell whether one already exists. They run expensive full refreshes because they do not trust the incremental logic.
Unity Catalog solves a lot of this, but only if it is used deliberately. Governance is not paperwork. It is the substrate that makes performance optimization possible at scale. This is one of the three pillars I focus on in my role at Entrada, alongside platform architecture and business value acceleration, and it is the one most often underinvested.
Pitfall 9: No Telemetry, No Improvement
You cannot optimize what you cannot measure. This sounds obvious, and yet most Databricks ML environments I review have either too little telemetry or too much of the wrong kind.
The right telemetry for an ML pipeline includes:
- Job-level cost and duration trends over time
- Per-stage Spark metrics for the heaviest transformations
- Model serving latency and throughput by endpoint
- Inference table data for prediction drift and input distribution shifts
- Business-outcome metrics tied back to model versions
In our work with high-performance domains like motorsport analytics, we found that the same telemetry-driven discipline that wins races also wins ROI battles. I wrote about that connection in Databricks Lakehouse AI for Telemetry-Driven Decisions, and the lesson translates directly to enterprise ML: data is not the advantage, the ability to turn data into fast, trustworthy, repeatable decisions is the advantage.
The Pattern Behind the Pitfalls
If you read this list again, you will notice something. None of these problems are about Databricks being slow or hard to use. Every one of them is about decisions made early in the pipeline lifecycle that nobody revisited.
That is the real performance pitfall. It is not technical. It is organizational.
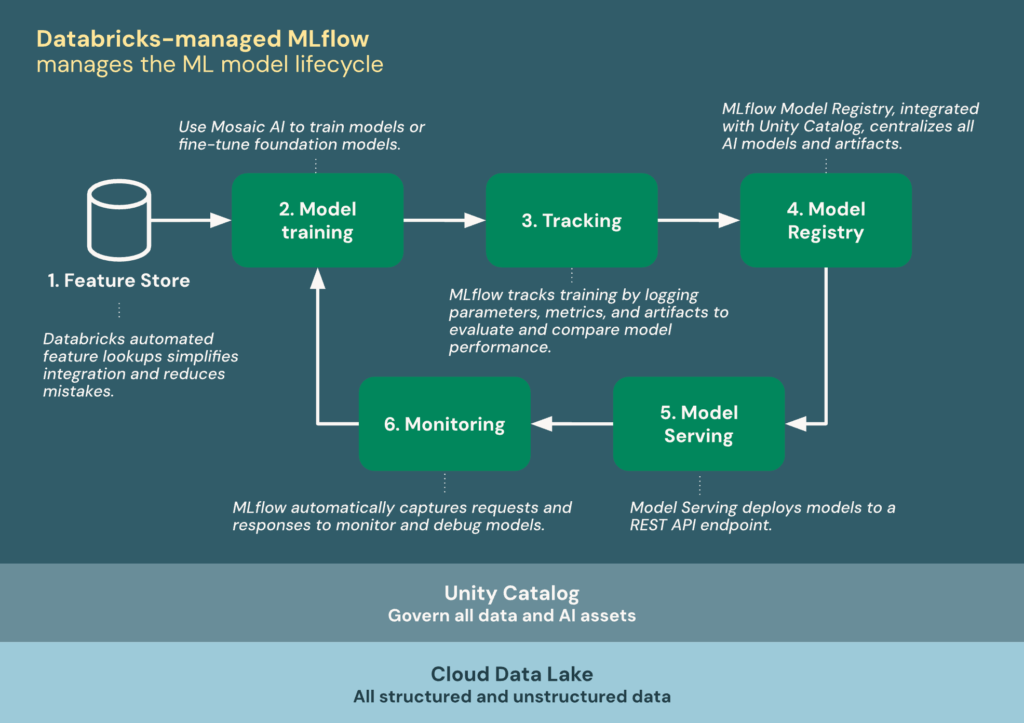
The strongest Databricks ML environments I work with share a few habits:
- Performance reviews are scheduled, not reactive. Pipelines are reviewed on a cadence, not when something breaks.
- Cost is a first-class metric. Every pipeline owner can tell you what their job costs and how that has trended.
- Architecture decisions are documented. Why a cluster is configured a certain way, why a table is partitioned a certain way, why a model is deployed a certain way.
- Monitoring is built in from day one. Not bolted on after the first incident.
- Governance enables performance. Unity Catalog is treated as a performance tool, not just a compliance tool.
Where to Start
If you are reading this and recognizing your own environment in several of these pitfalls, the good news is that you are not alone, and the fixes are well understood. The harder question is sequencing. You cannot fix everything at once, and trying to do so usually makes things worse.
A practical starting point is an honest assessment of where you are today. At Entrada, we offer an AI and Data Maturity Assessment that gives teams a structured view of their current state across architecture, governance, and operational discipline. For organizations earlier in their journey, our Race to the Lakehouse approach is designed to accelerate time to value while keeping the architectural and governance foundations strong from the start.
Final Thought
Performance in Databricks ML pipelines is not a technical curiosity. It is the difference between AI that scales sustainably and AI that becomes a quiet drain on the business. The platform gives you every tool you need to build pipelines that are fast, cost-efficient, and observable. The work is in making the decisions deliberately, reviewing them honestly, and treating performance as a discipline rather than a one-time task.
In enterprise AI, the teams that win are not the ones with the most sophisticated models. They are the ones whose pipelines keep delivering value, quietly and reliably, long after the launch announcement is forgotten.
If you would like to discuss how to apply these principles to your environment, get in touch with the Entrada team. We have helped clients across financial services, healthcare, manufacturing, and technology turn underperforming Databricks ML pipelines into reliable, governed, cost-efficient production systems, and we would be glad to do the same for you.