Data Engineering
  Data Strategy + Governance
  Data Migrations
  Concierge + Support
  Artificial Intelligence
  Training + Enablement
  Data Analytics + Insights
  Financial Services
  Communications, Media + Entertainment
  Healthcare + Life Sciences
  Technology + Digital Natives
  Manufacturing + Automotive
  Public Sector
  Retail + Consumer Goods
  Race to the Lakehouse
  AI + Data Maturity Assessment
  Unity Catalog
  Rapid GenAI
  Modern Data Connectivity
  Gatehouse Security
  Health Check
  Sample Use Case Library
  Blog
Blog  Events
  About Us
  Careers
  Founding Team
The 03:47 problem
Cutovers fail at 03:47 AM on a Tuesday. Not because anyone is careless. they fail because the migration team has been awake for nineteen hours, the source data team is asleep on a different continent, and the only thing on the screen is a Spark notebook with SELECT COUNT(*) FROM target returning 248,991,407 against a source of 248,991,442. The difference is “probably the late arriving fact partition, but we should check.” Nobody’s around to check. Somebody, eventually, has to make the call. Promote, or hold? On what evidence?
DataPact exists for that 03:47 conversation. Our 2.9 release shipped the validation engine that produces the evidence: count, hash, schema, null, aggregate, uniqueness, and custom SQL checks against any Databricks source/target pair, written into a curated managed schema, surfaced through an AI/BI dashboard. It worked. Customers used it. We learned the limits.
3.0 is the release where we stopped pretending the dashboard was the whole product. The dashboard remains and has matured, but the centre of gravity moved one floor up: to the shared managed Genie room, the conversational surface where engineers, operators, and execs ask the validation results in their own words and get back governed, reproducible, deterministic SQL rather than a hallucination dressed up in markdown.
The rest of this post explains what that shift cost us and why we think it’s the right shape for any serious data quality product on a Lakehouse.

What 3.0 actually changes
A non-exhaustive list, because we cut a lot, and what we cut matters.
One install per workspace. The biggest architectural decision in 3.0 is the rebase onto a single shared workspace-scoped control plane. One installation. Fixed /Shared/DataPact live root. Fixed <catalog>.datapact managed schema. One AI/BI dashboard. One Genie room. One asset registry. Anyone who has tried to operate multiple competing dashboards over the same source data knows why this matters: split-brain over what the headline number is, debates about whose Genie answered the same question differently, two truth surfaces racing each other on latest_run. We got rid of all of it by deciding it.
A real semantic backbone. Pre-3.0, downstream surfaces re-parsed result_payload JSON from run_history to compute everything from “is this critical?” to “which owner is in the worst shape?” Every dashboard widget had its own little re-implementation of the same logic. 3.0 introduces typed, curated fact tables – run_validations and run_checks – and a layer of helper views above them that pre-compute the answers most BI and Genie queries actually want: portfolio_latest_runs, validation_change_state, portfolio_compare_latest_vs_previous, portfolio_fix_first, forensics_scope_guard. On top of that sit four UC metric views (metric_validation_runs, metric_validation_domains, metric_validation_checks, metric_validation_validations) that BI and Genie consume as typed contracts. The semantic backbone is documented in docs/architecture/SEMANTIC_BACKBONE.md; you should read it cover-to-cover if you are going to extend the room.
The dashboard is now a serialised asset. We ship the dashboard as a vendored .lvdash.json and patch only catalog/schema at deployment time. Every dataset, widget, colour, position, and join is byte-stable across installs. There is a contract test (tests/contract/test_dashboard_query_fixes.py) that diffs the in-repo asset against the deployed payload after publish. SHA-256 parity is part of the release gate.
A managed Genie room you would actually let your CFO ask a question. Which is the rest of this post.
Why “curated Genie” is an engineering discipline, not a feature
If you have used Genie casually… pointed it at a Unity Catalog schema, asked it a natural language question, gotten back SQL plus a result… you know the experience can swing wildly between “this is the future” and “this just made up a column name.” The difference is rarely the model; it’s the room. A Genie space is a contract: which sources you have registered, which joins you have blessed, which SQL examples you have trusted, what value vocabulary you have encoded, and how you have told it to behave when the question’s scope is ambiguous. The model interprets that contract and synthesises against it. If the contract is sloppy, the answers are sloppy.
DataPact’s room is configured against four layers, in roughly increasing order of leverage:
- Sources. Eight tables and four metric views from
<catalog>.datapact, with column level synonyms and value dictionaries on the fields that matter (priorities, statuses, change states, domains, owners, products, blocker flags). - Join specs. Ten pre-blessed relationships that the room is told to use before it invents an ad hoc join.
portfolio_latest_runs↔portfolio_compare_latest_vs_previousis one of those join specs because it is the one users will reach for when they ask “what changed since last run for the worst job?” - SQL expressions. Nine business measures, dimensions, and filters expressed as raw SQL fragments:
realized_impact_usd,failed_validations,failed_checks,priority_rank,data_asset_path,cutover_blocker,latest_run_per_job,failing_validations_only,failed_checks_only. These exist because Genie should not have to re-derivecutover_blockerfrom raw status and priority on every question; we encoded the canonical definition once. - Trusted SQL examples + system instructions. Sixteen named benchmark questions, each with a ground-truth SQL answer and a regression tested expectation. The system instruction tells Genie to use the trusted SQL when a question matches an example, and to preserve the trusted row shape exactly.
Layered on top is the system instruction artifact, a single text block, ~20 lines of dense English that tells Genie what scopes are supported, what to do when scope is ambiguous (ask for clarification, not guess), how to render answers (one sentence scope aware summary, then a markdown table with the trusted column names), and how to handle empty results from trusted SQL (say “no rows matched in this scope”. do not widen filters to find a non-empty answer).

The output of all four layers, plus the instruction block, is datapact/genie/payload_contract.py — the file you would read if you wanted to understand DataPact’s product surface in one sitting. It is ~400 lines. The system instruction block is the centrepiece. A representative excerpt of the actual text we ship:
text_instruction(
    "shared-scope-contract",
    "Answer only from the curated shared DataPact semantic sources in this room.",
    "Treat portfolio_latest_runs as the portfolio snapshot and "
    "job_run_scope as the per-job run ledger.",
    "Supported scopes are: all jobs latest run each, one named job latest run, "
    "one named job all runs, exact run_id, or a named set of jobs latest run each.",
    "If scope would change the answer materially, ask a clarification "
    "question before answering instead of guessing.",
    "Use the shipped join specs for canonical relationships across "
    "portfolio_latest_runs, job_run_scope, run_validations, run_checks, "
    "and exec_domain_breakdown before inventing ad hoc joins.",
    "When a question exactly matches a shipped benchmark or trusted SQL example, "
    "answer from that trusted SQL example instead of improvising.",
    "When trusted SQL for an exact benchmark or trusted example returns zero rows, "
    "say that no rows matched inside the already selected scope and do not widen "
    "filters, pick a different job, or substitute a non-empty answer.",
    # ... eight more constraint lines covering scope management, render style,
    # benchmark handling, and empty-result discipline.
)
If that reads like a behaviour spec rather than a prompt, that’s the point. We treat it as code. It is pinned by a contract test (tests/contract/test_genie_audit_pass2_findings.py) that fails CI if any of the load bearing instruction phrases get edited or removed.
The benchmark loop
Three things happen in any product where the dominant interaction is generative:
- The model gets better and the surface gets worse, because new model versions interpret your room differently.
- The room gets better and the surface gets worse, because somebody added a new table and the existing instructions do not anticipate it.
- Both improve in lockstep and you find out from a customer.
We did not want option three. So 3.0 ships the benchmark suite: 16 named question specs, each with a ground-truth SQL answer and a row-shape expectation. The Benchmark tab in the Genie space exposes “Run all benchmarks” as a one-click action. It runs the 16 questions through Genie, executes both the model’s SQL and the ground-truth SQL, and assigns Good/Needs review/Bad based on result equivalence and SQL similarity.
The release gate, documented in docs/operations/GENIE_CURATION_RUNBOOK.md:
The shared Genie room is ready for release only when the managed benchmark pack pass rate meets or exceeds 0.90, monitoring review is current, the room still points at the governed shared semantic sources, and the dashboard and room still tell one coherent story.
Pass-rate ≥ 0.90 against a 16-spec pack is a deliberate choice. It is high enough that you cannot ship if Genie is hallucinating columns, low enough that you do not fail the gate when Genie reformulates WHERE x = 'PERSISTENT_FAILURE' as WHERE UPPER(x) = 'PERSISTENT_FAILURE' (semantically identical, textually different. The eval flags it as Needs review, not Bad).

A working example of how this loop bites: an audit caught Genie answering an “impact concentration” question with rows containing failing_validation_count = 0, alongside the real losers. Both queries returned a 5-row result. Both rendered legible. But the room was surfacing zero-impact products as if they were risk concentration, because the trusted SQL example had a WHERE rv.status = ‘FAILURE’ in the FROM clause and Genie’s reformulation moved that filter into a SUM(CASE WHEN rv.status = ‘FAILURE’ THEN …) conditional aggregation. Functionally equivalent for some shapes; not for this one.
The fix landed in three places: the trusted SQL gained an explicit HAVING to drop zero-impact rows; the system instruction got a new line forbidding zero-impact rows in any “where did the money go” answer; and a contract test pins both edits so a future revert fails CI. This is the loop. Audit → fix the contract → pin the contract → re-run the benchmark. There is no other discipline that produces a Genie space you would let your CFO use.
Validation-weighted aggregation, or: why the dashboard says 94.9 and Genie used to say 87.5
The most instructive 3.0 story is the smallest one. Two surfaces over the same data must agree on the headline number. Most of the time they do, because they query the same metric view. Sometimes they do not, because somebody picked a different aggregation.
The dashboard’s portfolio Trust Score widget computes:
SUM(`portfolio_trust_score` * `latest_total_validations`)
  / NULLIF(SUM(`latest_total_validations`), 0)
That is a validation-weighted average. A job with twelve validations contributes twelve times more weight to the headline than a job with one. It is the right number to show on a Portfolio Command tile because the question is “how trustworthy is the portfolio in aggregate?” and the answer should respect volume.
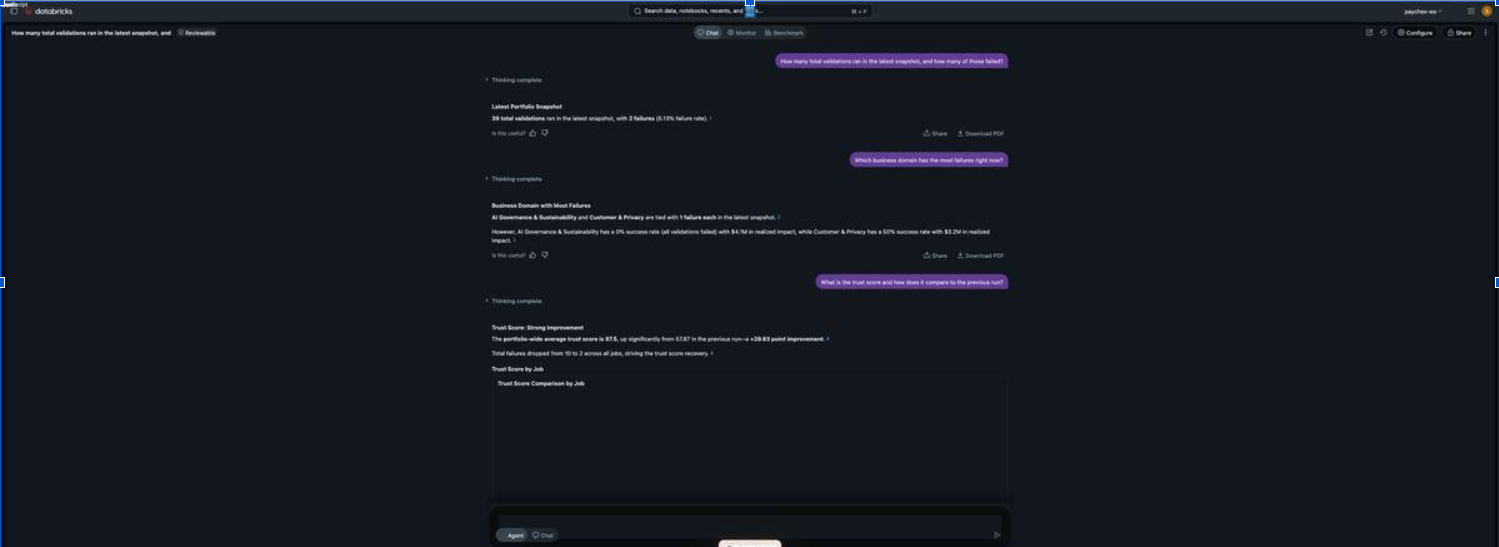
Until very recently, the room’s Trust Score measure in metric_validation_runs was a flat AVG(trust_score). Same data. Different aggregation. With four jobs and trust scores of 100, 100, 100, and 50, the dashboard read 94.9 (validation-weighted across 39 total validations) and Genie read 87.5 (simple mean across four jobs). Both correct on their own terms. Both wrong when juxtaposed.
The fix is the kind of one-line change you’d never write up if you weren’t proud of it:
- name: Trust Score
  expr: SUM(trust_score * total_validations) / NULLIF(SUM(total_validations), 0)
synonyms: ['trust', 'quality score']datapact/workspace/semantic_service.py:378. We applied the same fix to Success Rate Percent (line 375) and Domain Success Rate Percent (line 425), and added a system instruction line telling Genie to weight any portfolio wide trust score or success rate aggregate by total_validations even when synthesising on the fly. A regression test pins both: the YAML expression and the instruction phrase. We also added a belt-and-suspenders test (test_no_unweighted_aggregate_remains_for_score_or_rate_metrics) that fails if anyone re-introduces an unweighted AVG(trust_score) anywhere in semantic_service.py.
This is the kind of inconsistency that destroys trust in a conversational surface. the user pulls up the dashboard on one screen, asks Genie on the other, sees two different numbers, and the answer becomes “well, neither, then.” Reconciling the two surfaces is unglamorous infrastructure work. It is the work that decides whether your Genie room ships.
Sketches from the dashboard
The Lakeview surface gets less screen time in this post because the architectural story is dominated by Genie, but a few details are worth pointing out for engineers who will audit or extend it.
Six pages, one filter rail. Portfolio Command is the landing page; Change Intelligence and Forensics Lab are the two drill-throughs; Executive Overview and Detailed Breakdown are supplemental compatibility surfaces; Global Filters is the shared filter widget page. Every page reads from the same global filter rail, and the cross-filter behaviour is an AI/BI platform feature: clicking a bar in Domain Risk Concentration cross-filters Owner Pressure Index, the Domain × Priority Impact Matrix, and the Fix First Queue.
Eighty filter encodings, six hundred fifty widget bindings. When we audited the dashboard against the shipped .lvdash.json we counted 80 filter encoding bindings across 13 global filters and 650 widget × encoding × query bindings across 92 widgets. Every one of those bindings has to reference a field that the underlying query actually emits, or the filter chip silently routes an empty value, and you end up with the bug class we caught and fixed: a filter_priority chip that surfaced a literal 0 option because the Priority widget was incorrectly bound to current_business_priority_badge (a presentation field with a fall-through CASE) instead of the canonical current_business_priority. The generic regression test (test_global_filter_encoding_fields_are_emitted_by_referenced_queries) is what prevents this entire bug class from coming back, anywhere.
Validation-weighted Risk Contained %. Same pattern as Trust Score, applied to risk containment. The widget at line 2013 of the dashboard JSON computes:
SUM(`portfolio_risk_contained_pct` * `latest_potential_impact_usd`)
  / NULLIF(SUM(`latest_potential_impact_usd`), 0)
We had it as MAX(portfolio_risk_contained_pct) in an earlier 3.0 iteration. With three jobs at 100% containment and one at 12.5%, MAX shows 100, exposure-weighted shows ~90.1. The headline tile read 100 – meaning “fully contained” – when actual portfolio risk containment was about 90%. We caught it in audit, weighted it, pinned it.
Scope aware semi-additive aggregation. Portfolio Command’s Potential Loss and Actual Loss tiles bind to ds_portfolio_summary and use SUM(...) / GREATEST(COUNT(DISTINCT scope_filter_value), 1) rather than a bare SUM. The reason is that ds_portfolio_summary fans out the same job run rows across multiple scope bands so a single Run ID selection can override the default Scope Mode without parameter binding gymnastics. Naive SUM would multiply numbers across the fan-out. The semi-additive divisor undoes the fan-out only when multiple scope bands are present. It is the kind of pattern you write when you have been bitten by AI/BI parameter binding for the third time and decided to do scope as a real column predicate instead.
 and weekly_customer_feature_drift (Customer & Privacy, $3.2M).")
What it costs
Three things, briefly, that the people considering building something like this for their own product line should know.
Test discipline. 3.0 ships with 1,745 test definitions across tests/, organised into layered lanes: unit (hermetic logic), contract (frozen product contract assertions), integration (mocked end-to-end), security (governance), perf, and an opt-in live_workspace lane that runs against a real Databricks workspace. The contract layer is the load bearing one, every load bearing instruction phrase in the Genie room, every SQL expression in a metric view, every join spec, every benchmark spec is pinned by a contract test. The same test pack runs offline (no Databricks) so a contributor on a laptop can validate the room before requesting a CI workspace.
One serialised asset per surface. The dashboard is a .lvdash.json; the Genie room is a payload.py plus a benchmarks file plus a system instruction artifact, all of which serialise deterministically. Catalog and schema are the only patched fields at install time. Every other byte is byte stable across deployments. SHA-256 parity is checked post publish. The cost of doing it this way is real, you cannot make a quick edit in the UI and call it shipped, but the payoff is the dashboard the customer is looking at is exactly the dashboard that is checked into git, and we can prove it
A monitoring loop, not a finish line. The benchmark pack drifts. Customer questions do not match any of the 16 specs. The Monitor tab logs every question, with thumbs-up/down feedback, conversation type, and timestamps. The SME workflow we ship in GENIE_CURATION_RUNBOOK.md calls for a weekly review of low confidence routes, conversion of repeated clarifications into durable semantic metadata, and rewriting ambiguous prompts into benchmark safe forms. This is the part nobody writes about, because it does not fit on a slide. It is also the part that distinguishes a conversational surface that holds up at month six from one that gets quietly disabled in week three.
Working in the open
We have shipped four audit cycles’ worth of finding-and-fixing in the open. F-2 (a phantom 0 option in the Priority dropdown that broke four widgets to “No data” when selected). F-4 (the MAX(risk_contained_pct) headline that read 100 when it should have read 90.1). F-G1 (the validation weighted Trust Score reconciliation). F-G4 (the impact-concentration zero-row leak). Each fix is a one line change in code. Each fix is pinned by a contract test. Each fix has a paragraph of root cause explanation in the audit doc that tells you exactly which two surfaces disagreed and why.
The audits are checked in (dashboard_audit_findings.md, dashboard_audit_pass2_verification.md, dashboard_audit_pass3_signoff.md, dashboard_audit_pass4_master.md, genie_room_audit.md, genie_room_audit_pass2.md). They are not customer-facing – they are engineering artifacts – but if you are considering hiring a Databricks consultancy to do this kind of work, the audits are the sample you should ask for. Anyone can show you a finished dashboard. The interesting question is what they were willing to write down when something did not work.
What’s next
Not in this post:
- The federated impact view that lets a single DataPact install span multiple workspaces via Lakehouse Federation. We have a roadmap; we do not have the release. Q3.
- The cost aware scheduling decision (set a job schedule on first
create, never onreset, to avoid clobbering manual UI edits). - The 24-hour timeout ceiling we just landed for federated hash sweeps over 100M+ row tables. The default is 4h per task / 8h per job, configurable in YAML up to whatever Workspace governance allows. The detail nobody appreciates: the Databricks SDK serialises
JobSettings.timeout_seconds=Noneas an explicit 0, which Workflows treats as “time out immediately.” We omit the kwarg with None to dodge that. There is a comment injob_orchestrator.py:362-366that explains it; we recommend you read it before you write the same code.
3.0 is what it is because we decided early that the Genie room would be the thing customers fell in love with, and the dashboard would be the thing engineers used to verify the room. We picked an opinionated semantic backbone, layered the room over it with measured discipline, and put it all behind a benchmark suite with a release gate. Customers running migrations don’t ask “is the data right?” anymore. They ask the room.
If you’re building a Lakehouse and you are sleeping at 03:47 AM, that is the bar.
DataPact is built and maintained by Entrada, a Databricks Gold Partner. The full proprietary release kit ships at v3.0.0 and is installable in any Databricks workspace via the DAB first launcher. Docs, audits, and roadmap are public; correspondence and consulting engagement requests go to help@entrada.ai . The 03:47 problem is solvable. The room is open.