Data Engineering
  Data Strategy + Governance
  Data Migrations
  Concierge + Support
  Artificial Intelligence
  Training + Enablement
  Data Analytics + Insights
  Financial Services
  Communications, Media + Entertainment
  Healthcare + Life Sciences
  Technology + Digital Natives
  Manufacturing + Automotive
  Public Sector
  Retail + Consumer Goods
  Race to the Lakehouse
  AI + Data Maturity Assessment
  Unity Catalog
  Rapid GenAI
  Modern Data Connectivity
  Gatehouse Security
  Health Check
  Sample Use Case Library
  Blog
Blog  Events
  About Us
  Careers
  Founding Team
Every data platform team we work with has a cost dashboard. Very few of them have cost control.
The gap between those two states is where most FinOps programs stall. A dashboard tells us that compute spend grew twenty percent last quarter. It does not tell us which business unit drove that growth, whether the growth was productive or wasteful, which warehouses are over-provisioned, or what action to take this afternoon that will materially shift the curve by next billing cycle. Visibility without attribution is a report. Attribution without an action workflow is a lament. What enterprises need is a closed loop that runs continuously inside the same governed platform where the workloads themselves execute, and that loop is exactly what Databricks system tables, Unity Catalog, and Genie Spaces have quietly made possible.
The FinOps maturity arc
Before the architecture, a framing. We think about FinOps on Databricks as a four-stage progression, not a menu.
- Capture. Ingest every relevant signal, billing, query history, warehouse state, workload metadata, user identity, tag hierarchies, into a trusted substrate. No cleverness yet. Just completeness.
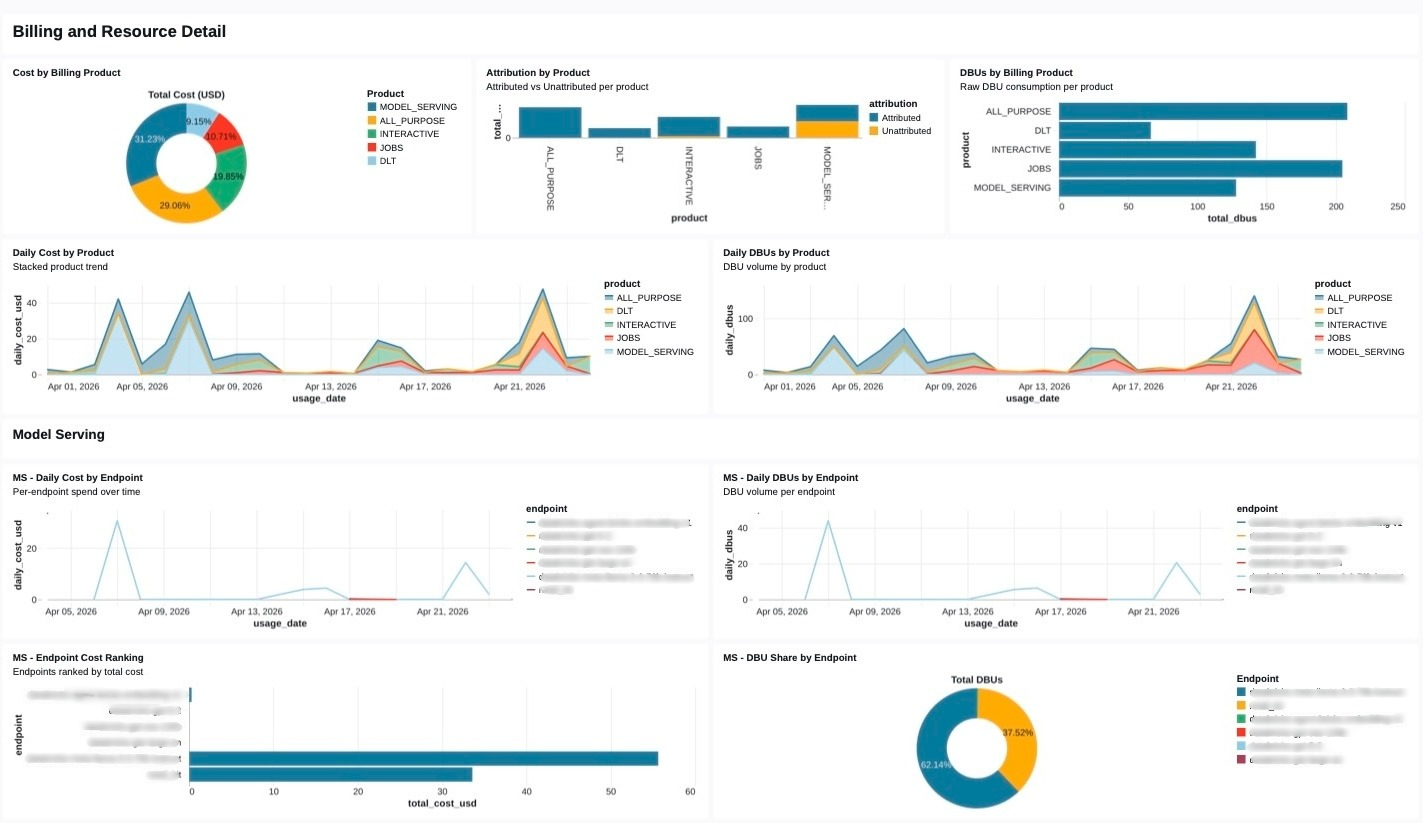
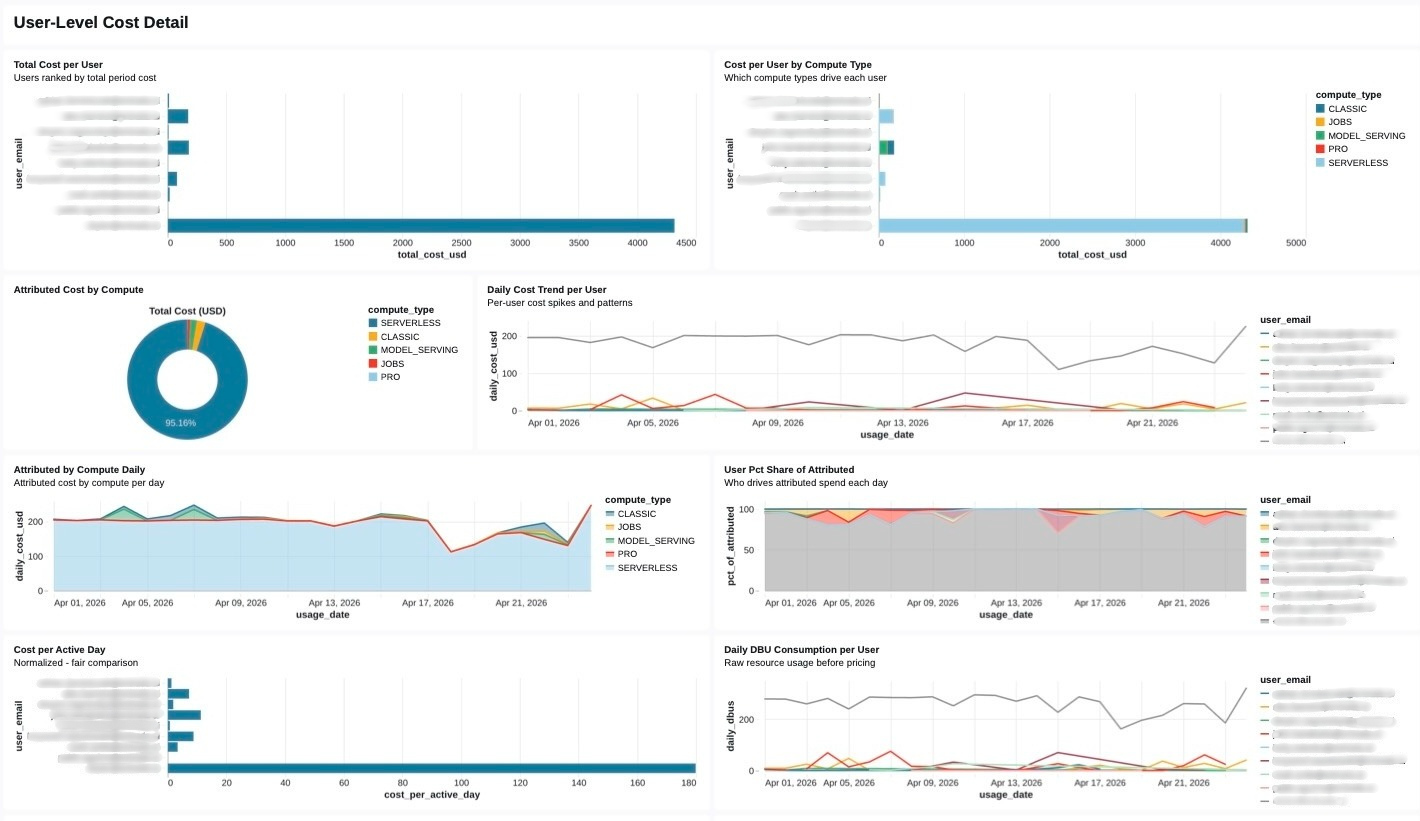
- Curate. Join those raw signals into a domain model that a human CFO can reason about: cost per business unit, cost per product, cost per job, cost per team, cost per user. This is where tag hygiene stops being a governance chore and starts being the core of our chargeback system.
- Analyze. Put that cost model in front of analysts and executives, visually through dashboards, conversationally through Genie. Both modes are necessary. Neither is sufficient alone.
- Act. Close the loop with budget policies, right-sizing workflows, approval queues, and chargeback reports. The signal from stage 3 must flow back into platform configuration, not just into an email thread.
Most teams live in stage 1 or stage 2 and pretend they are in stage 3. The accelerator is opinionated about moving the entire organization to stage 4.
Why Databricks system tables are the right foundation
The single most important architectural decision in a FinOps program is what we measure and where the measurement lives. If cost telemetry lives outside our data platform, in a cloud provider’s billing export, in a third-party cost management SaaS, in a CSV someone exports from the portal, every downstream capability inherits the friction of that boundary. We cannot join billing data to query data easily. We cannot govern access to sensitive attribution details using the same RBAC model we use for everything else. We cannot put a conversational interface on top of it without building an entirely separate semantic layer.
Databricks system tables collapse that boundary. The data that makes our workloads run, and the data that tells us what those workloads cost, live in the same Unity Catalog metastore, governed by the same permissions, queryable by the same SQL engine, reachable by the same BI tools and the same AI interfaces.
The tables that matter most for cost control:
| System table | What it tells us |
system.billing.usage | DBU consumption by workspace, SKU, cluster, and usage metadata (billing period, usage unit, list cost) |
system.query.history | Every SQL query executed against a warehouse: duration, rows produced, user, warehouse, statement text |
system.compute.warehouses | SQL Warehouse configuration and lifecycle events (size, cluster count, auto-stop, lifecycle transitions) |
system.lakeflow.jobs | Job and task metadata: names, owners, run outcomes |
system.access.audit | Every governance event: who touched what, when, from where |
The architectural leverage comes from the fact that these tables share join keys. A single query can take us from ‘dollar cost in May’ to ‘which user ran the expensive queries’ to ‘which business unit that user belongs to’ in three joins, all inside a governed, auditable query engine. That is something a cloud billing export, no matter how detailed, cannot provide.
Here is the kind of query the curated layer exposes, simplified, but structurally representative of what runs behind the accelerator’s cost mart:
WITH usage AS (
  SELECT
    usage_date,
    workspace_id,
    usage_metadata.warehouse_id AS warehouse_id,
    usage_metadata.job_id        AS job_id,
    custom_tags                  AS tags,   -- map<string,string> from resource tags
    SUM(usage_quantity)          AS dbus,
    SUM(usage_quantity * list_prices.pricing.default) AS list_cost_usd
  FROM system.billing.usage
  LEFT JOIN system.billing.list_prices
    USING (sku_name)
  WHERE usage_date BETWEEN :start AND :end
    AND billing_origin_product IN ('SQL', 'JOBS', 'INTERACTIVE')
  GROUP BY ALL
),
attributed AS (
  SELECT
    u.*,
    COALESCE(
      u.tags['cost_center'],        -- primary signal: resource-level tag
      bu_map.cost_center,           -- fallback: workspace → BU lookup
      'UNATTRIBUTED'
    ) AS cost_center,
    COALESCE(u.tags['env'], 'unknown') AS environment
  FROM usage u
  LEFT JOIN governance.reference.workspace_to_business_unit bu_map
    ON u.workspace_id = bu_map.workspace_id
)
SELECT
  usage_date,
  cost_center,
  environment,
  SUM(dbus)          AS dbus,
  SUM(list_cost_usd) AS list_cost_usd
FROM attributed
GROUP BY ALL;
Two things are worth noticing. First, the join to list_prices is the canonical way to attach dollars to DBUs inside Databricks, not an external price book. Second, the COALESCE chain over custom_tags → bu_map → 'UNATTRIBUTED' encodes an opinionated policy about attribution precedence. Making that policy explicit in SQL is how we prevent silent drift between what the dashboard says and what finance believes.
Tags are our chargeback schema
The part most FinOps programs underestimate is how much of the chargeback model lives in tag hygiene rather than in query logic. A beautiful cost mart with forty percent of its rows tagged UNATTRIBUTED is a social problem, not a SQL problem.
The accelerator leans hard on Unity Catalog governed tags for this, tags with declared allowed values, enforced at write time, and auditable through system.access.audit. The design pattern:
- Each SQL Warehouse, Job, and Pipeline is tagged at create time with
cost_center, env, owner_email,anddata_product. - A governance pipeline reconciles those tags against an authoritative Business Unit → Cost Center registry, and raises alerts for any workspace whose monthly
UNATTRIBUTEDdollars cross a threshold. - Tag schema drift, somebody creating a warehouse with
costcenterinstead ofcost_center, is caught automatically because governed tags reject unknown values.
This is where the FinOps program stops being a separate initiative and becomes a byproduct of the governance practice. The same tag that unlocks ABAC masking for a sensitive column is the tag that routes its compute cost to the right P&L. One vocabulary, two outcomes.
Right-sizing at fleet scale
Attribution tells us where the money went. Right-sizing tells us where the money is being wasted. These are different questions and they deserve different engines.
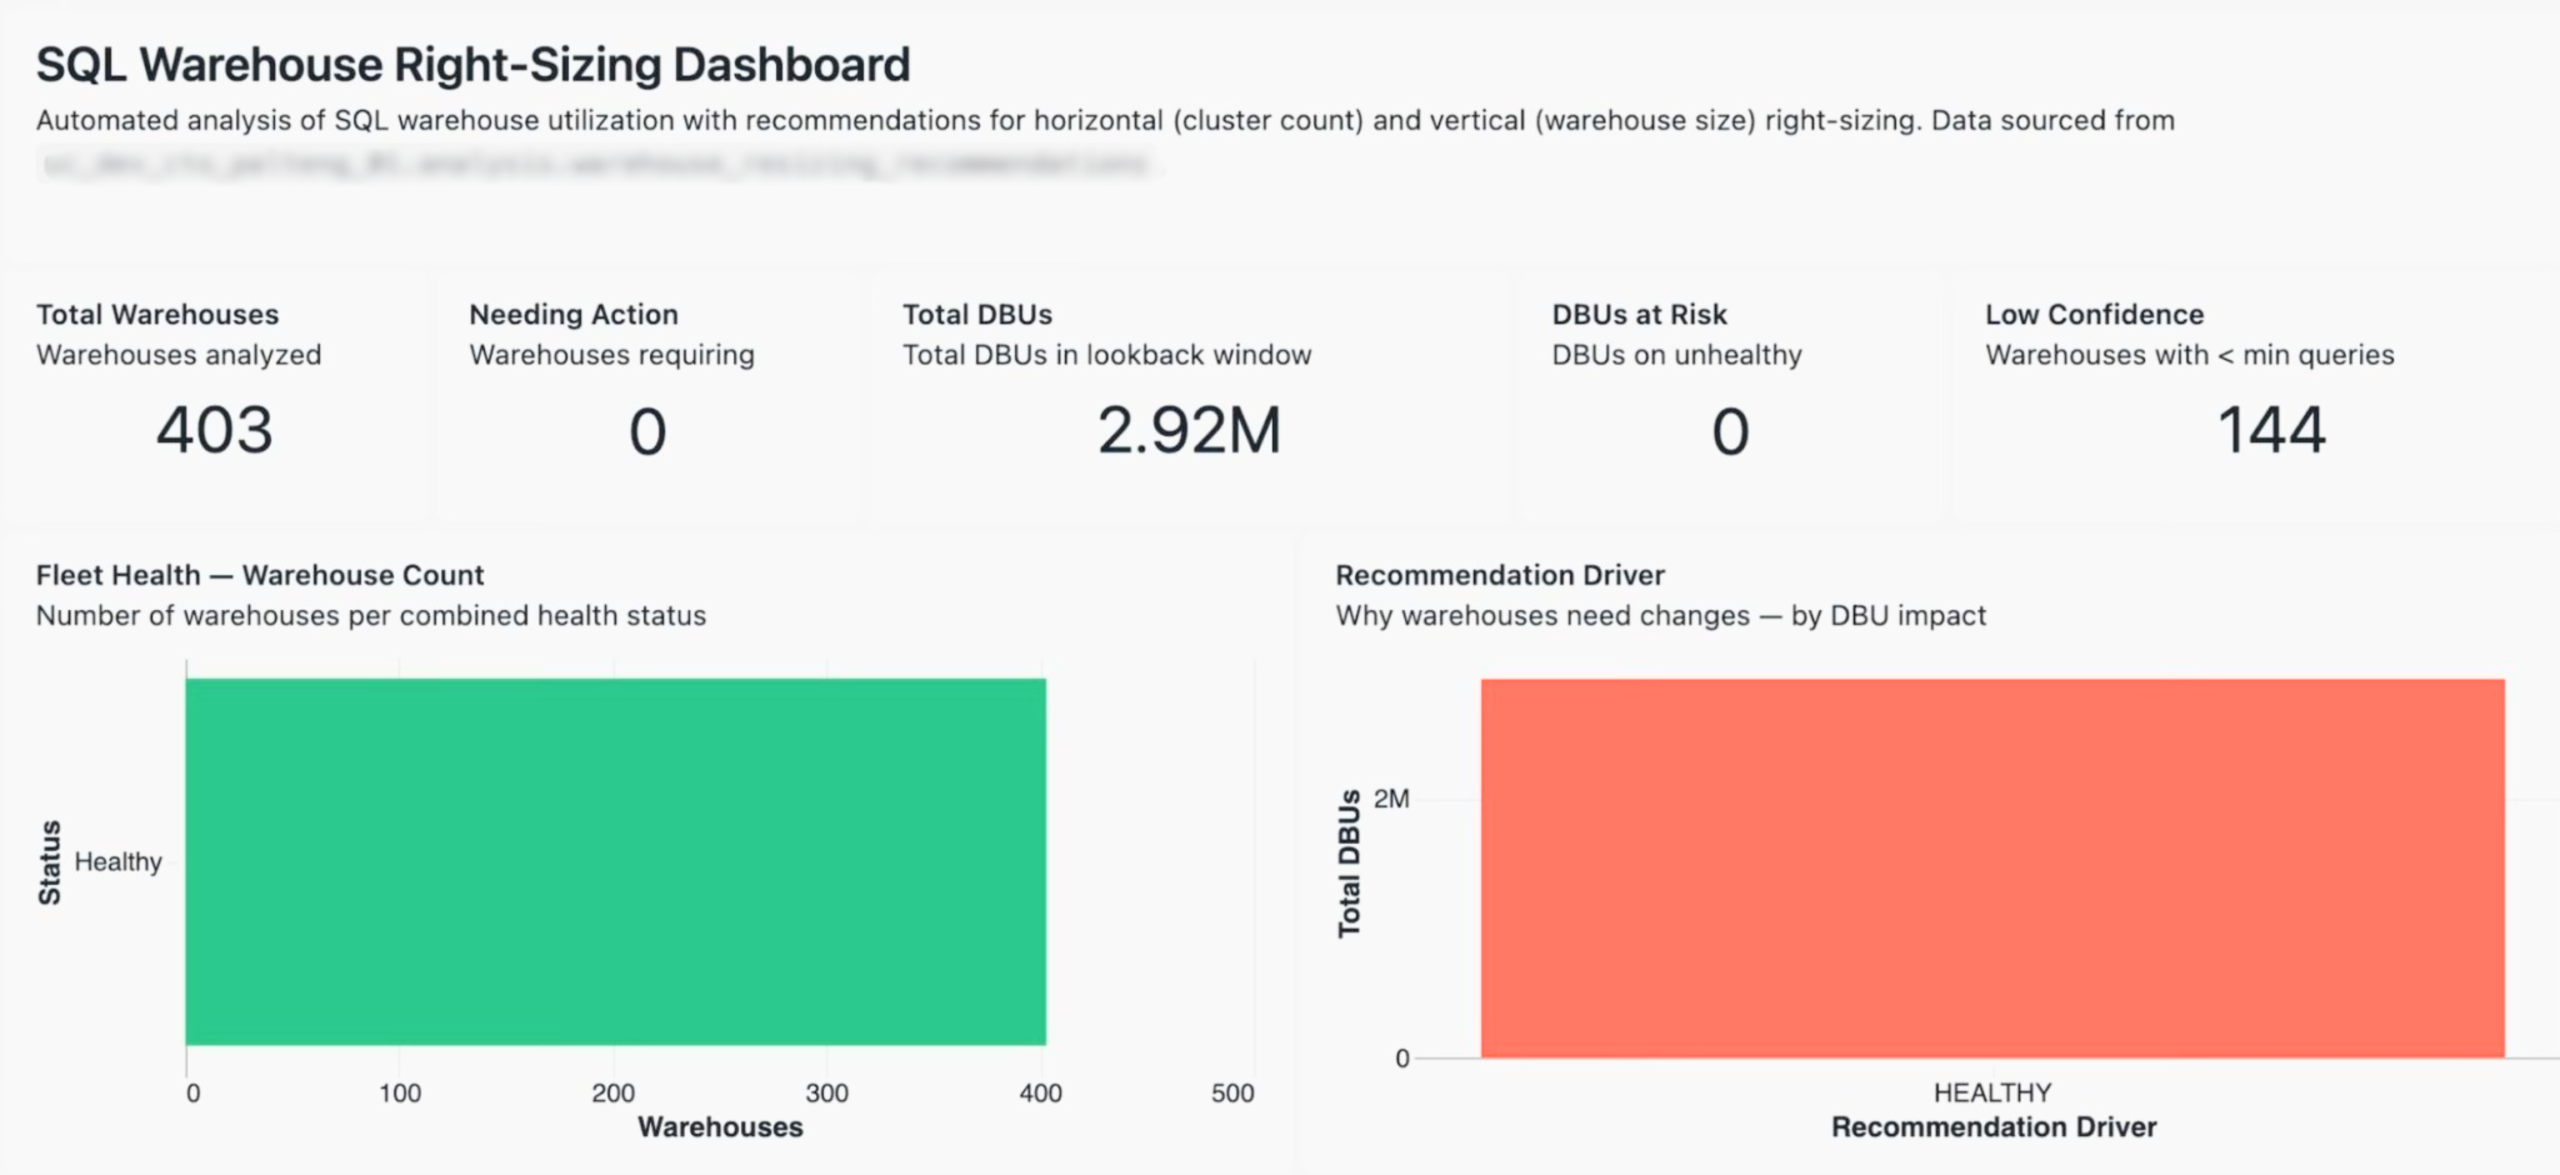
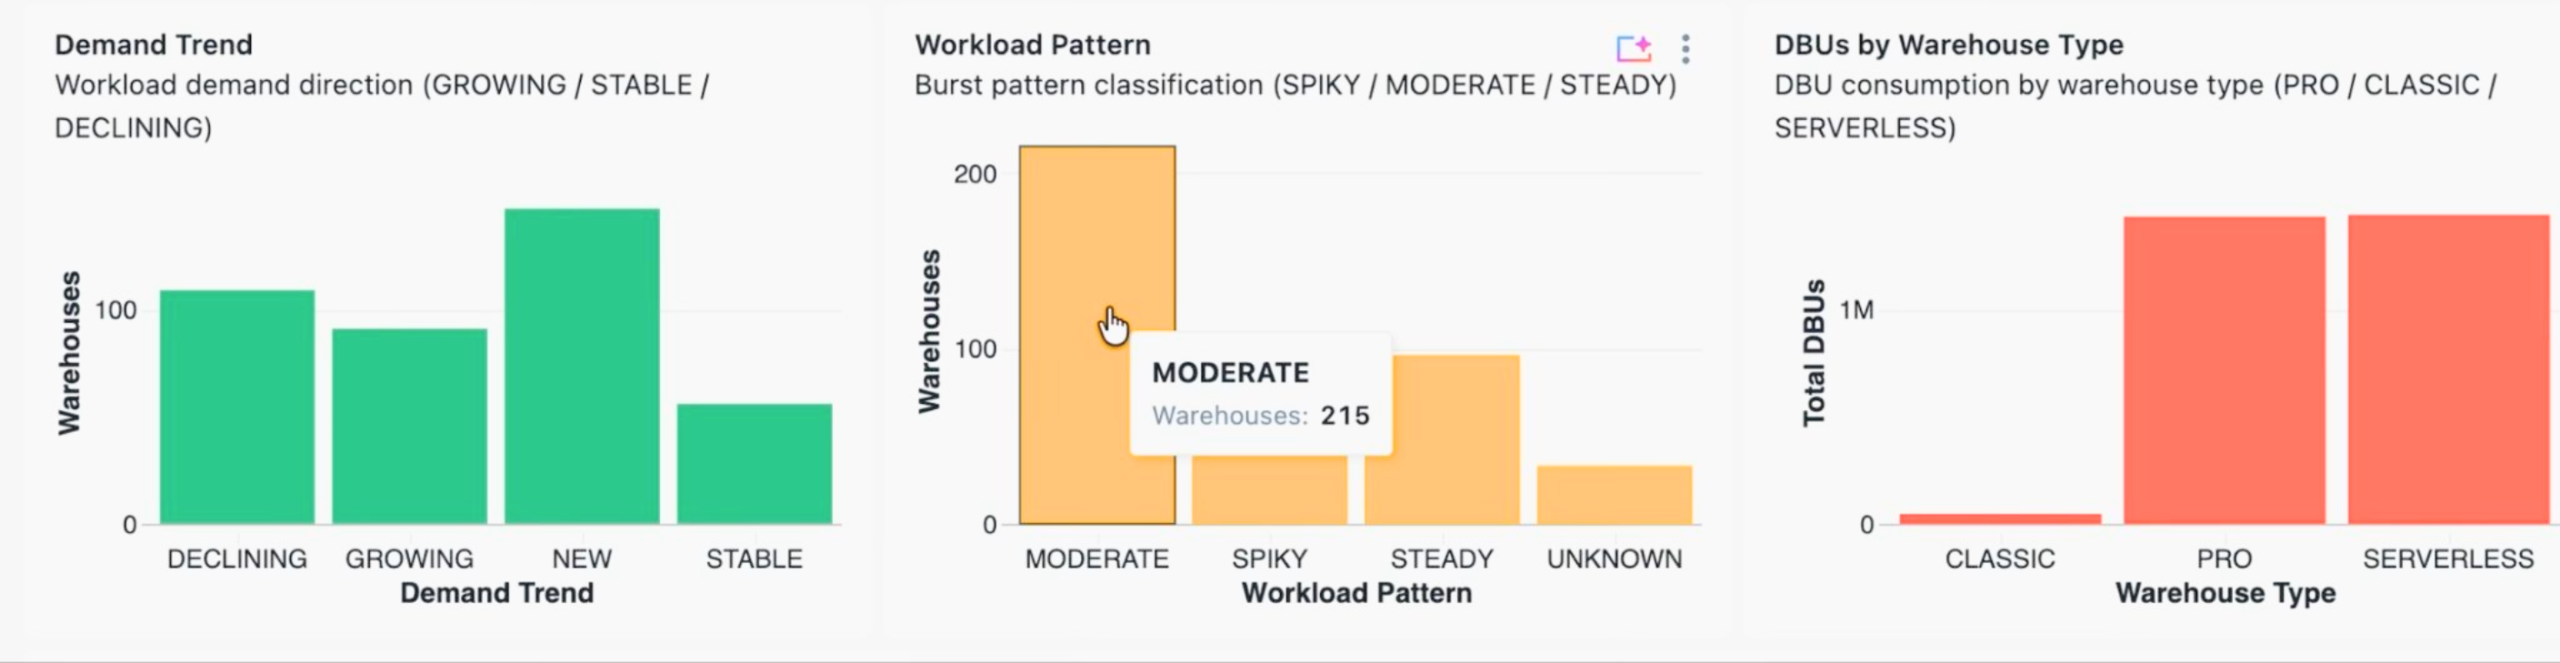
In a recent customer fleet we analyzed, 403 SQL Warehouses across a global footprint, consuming 2.92 million DBUs in the trailing lookback window, the recommendation engine had to answer four distinct questions per warehouse:
- Is there enough data to make a recommendation at all? (Low-confidence warehouses, defined as those with fewer queries than a minimum threshold, are excluded. In this fleet, 144 of 403 fell into that bucket.)
- What is the demand trend? (Growing, stable, declining, or new. This governs whether we should size for headroom or for the current median.)
- What is the workload pattern? (Spiky, moderate, or steady. This drives horizontal, cluster count, decisions, not vertical ones.)
- What is the health status, combining saturation and idle time? (A warehouse can be simultaneously over-provisioned on the vertical axis and under-clustered on the horizontal axis.)
The output is a per-warehouse recommendation with a driver, HEALTHY, DOWNSIZE_VERTICAL, UPSIZE_HORIZONTAL, and so on, and a projected DBU delta if the recommendation is implemented. Crucially, recommendations are materialized into a Delta table (analysis.warehouse_resizing_recommendations) with a daily analysis_date partition.
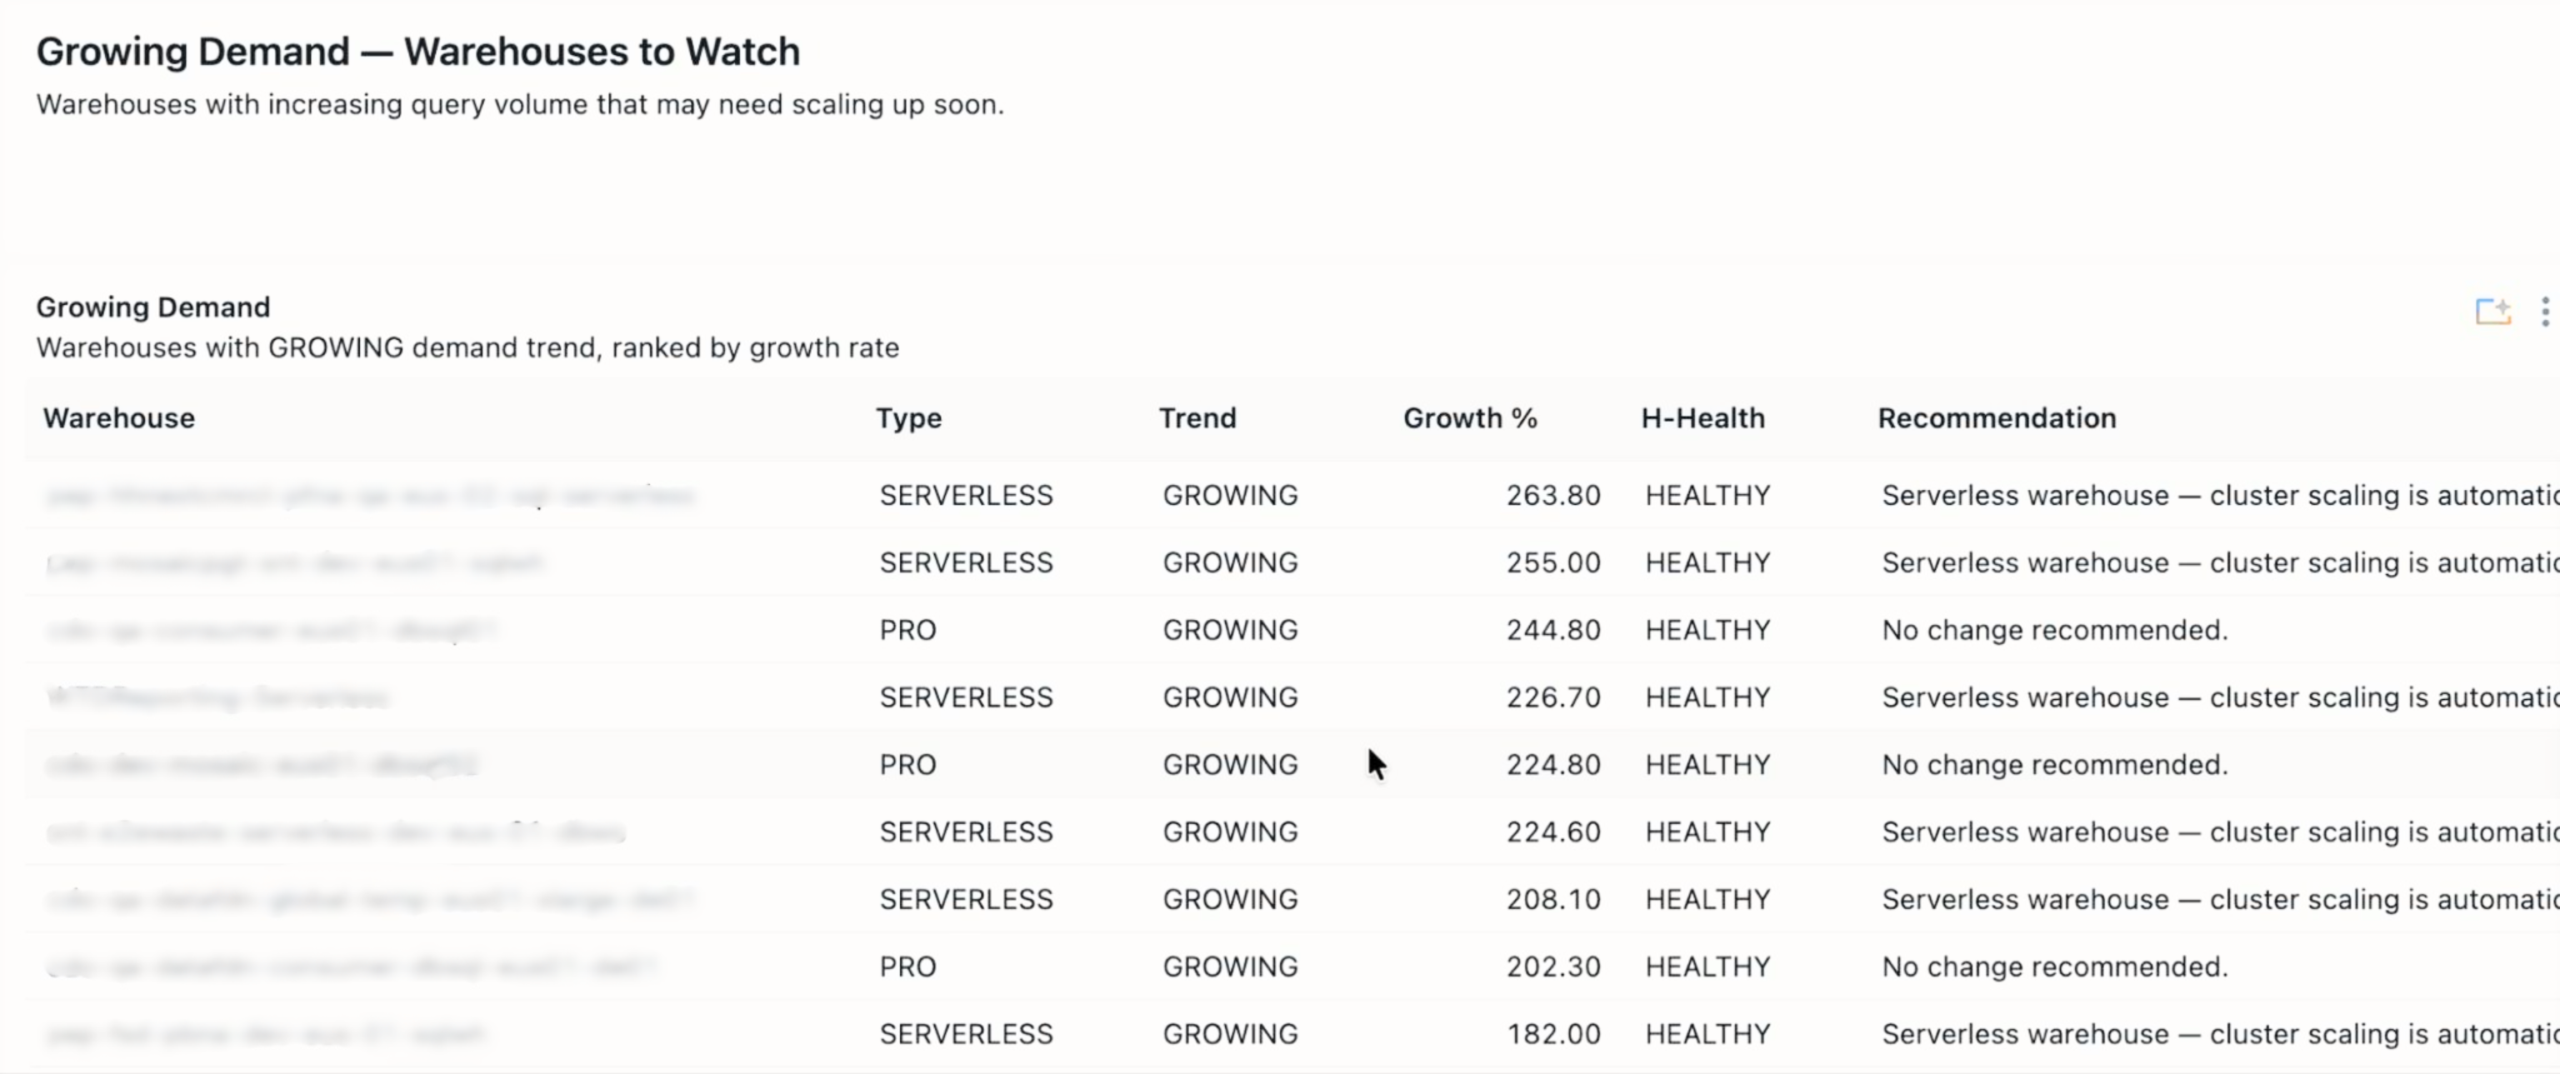
This design choice enables two things that are otherwise painful:
- Trend dashboards. We can chart how the number of warehouses needing action is moving over time, and whether our team is actually working the queue down.
- Auditability. When someone asks why a warehouse was downsized on April 12th, the evidence is the row that ran the recommendation that day, not a transient Databricks notebook output that nobody saved.
The dashboard pattern is the standard ‘latest snapshot’ idiom:
SQL:
WITH latest AS (
  SELECT
    *,
    ROW_NUMBER() OVER (PARTITION BY warehouse_id ORDER BY analysis_timestamp DESC) AS rn
  FROM analysis.warehouse_resizing_recommendations
  WHERE analysis_date = (SELECT MAX(analysis_date) FROM analysis.warehouse_resizing_recommendations)
)
SELECT
  COALESCE(warehouse_name, warehouse_id) AS warehouse_name,
  warehouse_type,
  recommendation_driver,
  total_queries,
  projected_dbu_delta
FROM latest
WHERE rn = 1
ORDER BY projected_dbu_delta DESC;
Plain old SQL, and that is the point! Plain old, deterministic, reproducible SQL is what makes the upstream recommendation engine’s heuristics trustworthy.
Genie as the FinOps interface
Dashboards are necessary but they are not how executives actually think. A SVP asking ‘what did our SQL Warehouse spend look like in APAC last month, and why was it higher than March’ does not want to click through seven filters. They want to ask the question in English and get an answer grounded in the same curated cost model that the dashboard sits on.
Genie Spaces is the right primitive for this, but only if we configure it correctly. The failure mode of natural-language analytics is not that it refuses to answer, it is that it answers wrong with confidence. Three practices keep Genie trustworthy for FinOps:
- Point Genie at the curated marts, not the raw system tables. The semantic model Genie reasons about should match the model our finance team has already validated. If an analyst and Genie disagree on what ‘cost center’ means, that is a cost-mart problem, not a Genie problem.
- Seed certified queries. The cost control Genie Space ships with a library of SME-reviewed example queries:
top 10 warehouses by DBU growth month over month, which cost centers exceeded their budget policy last week, show me jobs with the highest cost per successful run. These examples are what calibrate Genie’s SQL generation on our specific schema. - Govern the Space itself. Genie inherits Unity Catalog permissions. The same ABAC masking that protects PII from a direct query protects it from a Genie answer, with no additional configuration. This is the sleeper advantage of putting FinOps inside Databricks rather than bolting on a third-party tool: the security posture is a property of the platform, not of the app.
A representative semantic snippet from the Space’s configuration:
semantic_model:
  tables:
    - name: fct_daily_cost
      description: >
        Daily attributed Databricks cost grounded in system.billing.usage joined
        to list_prices. One row per (usage_date, cost_center, environment,
        workload_type). Use this table for any question about spend, not the
        raw billing tables.
      primary_measures:
        - name: list_cost_usd
          description: List-price cost in USD. Use for chargeback and budgeting.
        - name: dbus
          description: DBU consumption. Use for capacity questions, not dollars.
      common_filters:
        - "environment = 'prod'"
        - "cost_center != 'UNATTRIBUTED'"
  certified_queries:
    - name: monthly_spend_by_cost_center
      question: What was our spend by cost center last month?
      sql: |
        SELECT cost_center, SUM(list_cost_usd) AS spend_usd
        FROM fct_daily_cost
        WHERE usage_date >= date_trunc('month', current_date() - INTERVAL 1 MONTH)
          AND usage_date <  date_trunc('month', current_date())
        GROUP BY cost_center
        ORDER BY spend_usd DESC
The descriptions on the measures matter more than they look. When an executive asks ‘what did we spend,’ Genie will pick list_cost_usd, not dbus, because the description tells it which measure answers dollar questions. Investing an hour in this file is the single highest-leverage thing a FinOps team can do to make Genie reliable.
Closing the loop: from insight to action
Analyzing waste is worthless if nobody implements the fix. The accelerator’s fourth stage, action, is where most FinOps platforms trail off into dashboards-and-good-intentions, so we’ve been deliberate about making action a first-class surface.
Three action patterns ship in the accelerator:
- Serverless Budget Policies. Budgets are expressed as YAML and applied via Databricks Asset Bundles, which means they flow through CI like any other piece of configuration. A budget breach is a platform event, it can trigger alerts, suspend policies, or simply post to a channel, but it does so consistently across environments.
- Chargeback/showback reporting. Monthly exports per cost center, generated on the 1st by a Lakeflow Job, posted to finance’s SharePoint. The report is a Materialized View, which gives Predictive Optimization something to optimize without us having to manage it.
- Optimization workflows. This is the pattern the cost-tracker dashboard in the accelerator embodies. Recommendations flow into a tracked pipeline with phases, identified → approved → implemented → realized, and each phase has its own dollar totals. In a recent fleet, the tracker surfaced $3.11M of identified savings opportunity; by the time the dashboard snapshotted, $1.41M of that had been realized as an annual run-rate reduction. Without the phase tracking, those numbers collapse into a single undifferentiated ‘potential savings’ figure that nobody trusts and nobody acts on.
What ties these three together is that they all write back to Unity Catalog, the budget policies as state, the chargeback reports as Delta tables, the optimization decisions as rows in an approval ledger, which means they all appear in system.access.audit and are themselves auditable. The FinOps program becomes a reproducible pipeline rather than a set of heroic spreadsheet exercises.
The larger pattern: FinOps as a platform surface
The theme that runs through this architecture, and through the companion governance and audit evidence work we’ve published separately, is that system tables are turning Databricks into an introspectable platform in a way that platforms rarely are. The same substrate that answers ‘what did this cost’ also answers ‘who accessed this column’ and ‘when was this classification first enforced.’ The same Genie patterns that democratize cost analysis democratize compliance reporting. The same governed tags that drive chargeback drive ABAC masking.
FinOps, in this world, stops being a separate tool and becomes a surface, a particular lens on a platform that already has everything it needs. The work, for practitioners, is less about sourcing new technology and more about choosing good primitives and composing them deliberately.
That is the thesis behind the Serverless Cost Control Accelerator, and it is why we think the FinOps programs that win over the next two years will be the ones that build on the data platform rather than beside it.
The Serverless Cost Control Accelerator is a Databricks Brickbuilder Accelerator delivered by Entrada. If you’re evaluating how to move your FinOps program from visibility into action, we’d love to talk – reach out at info@entada.ai.